
Home Month: March 2026

Month: March 2026

How IoT-Based Smart Grid Integration Improves Outage Management and Fault Detection

Every unplanned power outage in India tells two stories. The first is the one consumers experience – the inconvenience, the disrupted operations, the economic cost of interrupted supply. The second is the one utilities live through – the frantic phone calls to the control room, the field teams dispatched without precise location information, the manual restoration process that takes far longer than it should, and the post-event uncertainty about what actually caused the fault.

For decades, both of these stories have played out the same way, driven by the same fundamental problem: most of India’s distribution grid has been operating blind. Without real-time visibility into what is happening at the feeder, Distribution Transformer, and consumer level, outages are detected reactively – when consumers complain – and faults are located through manual field inspection rather than data-driven diagnosis.

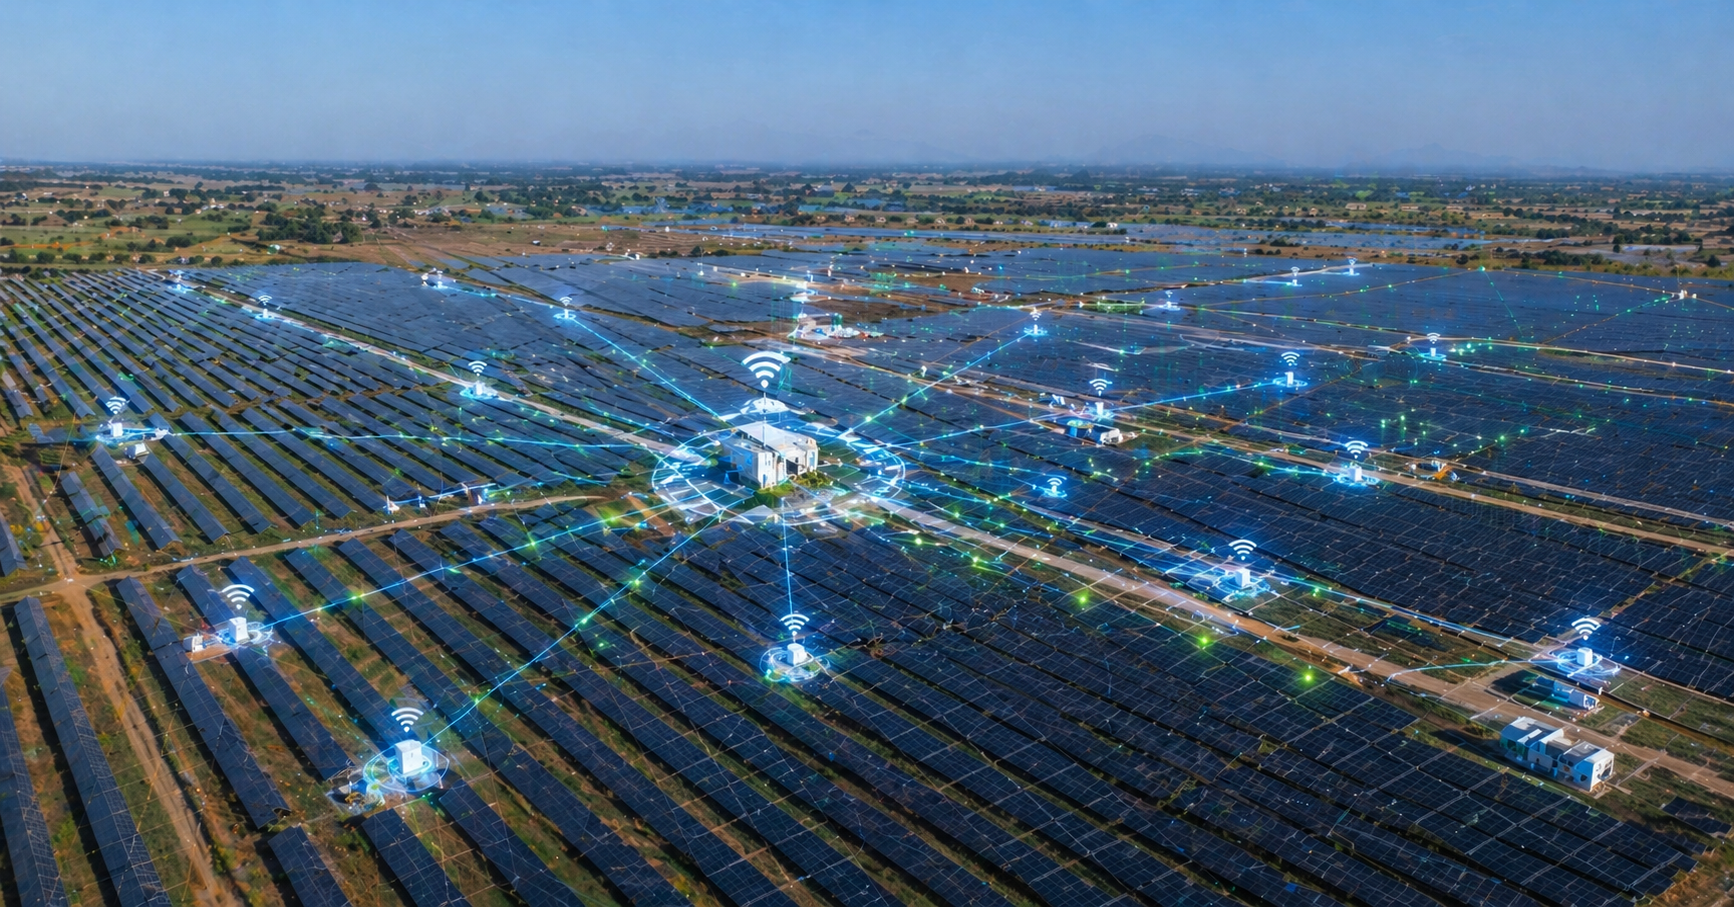
IoT-based smart grid integration is changing both stories. By embedding connected sensing, monitoring, and communication capabilities throughout the distribution network – from the substation to the last-mile feeder – it gives utilities the real-time grid visibility that transforms outage management from a reactive scramble into a proactive, data-driven operation. This blog explains how that transformation happens, what it means for Indian DISCOMs, and what a well-designed IoT smart grid system looks like in practice.

The Core Problem: Why Traditional Outage Management Falls Short

To understand why IoT-based smart grid integration matters so much for outage management and fault detection, it helps to be clear-eyed about how the process works without it – and why that approach is fundamentally inadequate for a modern distribution network.

In a conventional distribution grid, the utility’s awareness of an outage depends primarily on consumer calls to the helpline. When supply fails at a consumer’s premises, they call to report it. The call centre logs the complaint, a field crew is dispatched to investigate, and restoration proceeds – guided by the crew’s knowledge of the network topology and their physical inspection of the infrastructure.

This process has several compounding problems. First, there is an inherent time delay between when an outage occurs and when enough consumers have called to allow the utility to identify its approximate location. Second, the field crew dispatched to investigate often knows only that there is a fault somewhere in a particular section of the network – not exactly where, or what caused it. Third, restoration verification depends on the field crew confirming supply has been restored, or waiting for consumer callbacks to stop – neither of which is precise or timely.

The result is that Mean Time to Repair (MTTR) – the average time between an outage occurring and supply being restored – is far higher than it needs to be. And every additional minute of outage duration represents real economic cost: to consumers whose operations are disrupted, and to the DISCOM whose AT&C losses increase during unmetered supply interruption periods.

Beyond outages, incipient faults – deteriorating cable insulation, corroded connections, overloaded transformers approaching failure – are invisible in a grid without continuous monitoring. These faults develop gradually, often over weeks or months, before triggering an acute failure. Without the ability to detect them early, the utility can only respond after the failure has occurred – by which point the damage is done and a planned maintenance intervention has become an emergency repair.

What IoT Smart Grid Integration Actually Means

The phrase “IoT smart grid integration” covers a broad technology landscape. For the purposes of outage management and fault detection – the operational functions that most directly affect DISCOM performance and consumer service quality – the relevant components are:

1. Smart Meters as Grid Sensors

The smart meters deployed under RDSS and other metering programmes are not just billing devices. They are distributed sensors embedded throughout the low-voltage network. Every smart meter continuously monitors voltage at the point of supply, logs power outage and restoration events with precise timestamps, detects tamper events, and measures power quality parameters.

When a fault causes supply to fail, meters at the affected premises send a “last gasp” signal – a brief transmission made using the meter’s internal capacitor power reserve in the milliseconds before supply is completely lost. These last gasp signals arrive at the Head-End System almost simultaneously with the fault event itself, giving the control room instant awareness of which meters have lost supply – without waiting for a single consumer call.

By mapping the geographic pattern of meters reporting loss of supply, the MDMS can identify the probable location of the fault with significant precision – narrowing the search from an entire feeder section to a specific DT or cable segment. This transforms the field crew’s task from open-ended investigation to targeted intervention.

This is the foundation of how Probus’s smart metering solutions contribute directly to grid operational intelligence – the meter is not just a data collection device for billing, but a sensing node in a broader IoT grid monitoring network.

2. Distribution Transformer Monitoring

The Distribution Transformer is one of the most critical – and most vulnerable – assets in the low-voltage distribution network. DTs are subject to overloading, oil degradation, winding insulation failure, and the cumulative stress of irregular load patterns. In India, premature DT failure is a significant operational and capital cost for most DISCOMs – both because of the direct cost of transformer replacement and because of the supply interruption that accompanies failure.

IoT-based DT monitoring devices measure load current, voltage, oil temperature, and power factor continuously at the transformer level. By analysing these parameters in real time and trending them over time, the monitoring system can identify DTs that are running hot, overloaded, or showing early signs of insulation degradation – weeks or months before a catastrophic failure occurs.

This enables a shift from reactive DT replacement – waiting for failure – to predictive maintenance – intervening before failure, at a time and in a manner that is planned, cost-effective, and does not result in unplanned supply interruption. For a DISCOM managing thousands of DTs across its network, the cumulative operational and capital cost savings from predictive DT maintenance are substantial.

3. Feeder and Substation Automation

At the feeder and substation level, IoT integration involves the deployment of remote terminal units (RTUs), intelligent electronic devices (IEDs), and automated switching equipment that can be monitored and controlled from a central SCADA or Distribution Management System (DMS). Fault indicators installed along feeder lines detect and log fault current events, allowing the control room to identify not just that a fault has occurred but at which point along the feeder it is located.

In networks equipped with automated sectionalising switches, fault isolation and network reconfiguration can be performed remotely – isolating the faulted section and restoring supply to the unaffected portions of the feeder without requiring a field crew to manually operate switching equipment. This dramatically reduces the number of consumers affected by a fault and the duration of supply interruption for those who are.

4. Power Quality Monitoring

Beyond outage events, the IoT energy meter and grid sensor network continuously monitors power quality parameters – voltage sags and swells, harmonic distortion, frequency deviation, and power factor. These parameters affect both consumer equipment reliability and grid asset health. Chronic voltage sags in a particular feeder section may indicate a network impedance problem. Persistent harmonic distortion may signal the proliferation of non-linear loads that are affecting grid power quality.

Real-time power quality monitoring allows the utility to identify and address these conditions proactively – before they result in consumer complaints, equipment damage, or regulatory non-compliance. It also provides the data needed to plan network reinforcement investments based on actual power quality conditions rather than theoretical load projections.

From Data to Action: How Real-Time Grid Monitoring Works in Practice

The value of IoT smart grid integration is not in the data itself – it is in what the utility does with that data. The operational workflow that translates real-time energy monitoring system data into improved outage management looks like this:

Step 1 – Event Detection: A fault occurs on the network. Smart meters in the affected area send last gasp signals. DT monitoring devices log the loss of secondary voltage. Fault indicators on the feeder register the fault current event. All of these signals arrive at the central monitoring platform within seconds of the fault occurring.

Step 2 – Fault Location: The monitoring platform analyses the pattern of signals – which meters reported supply loss, which DT monitoring device registered a voltage drop, which feeder fault indicator logged a current event – and uses network topology data to calculate the probable location of the fault. An alert is generated in the control room with the fault’s likely location identified to a specific feeder section or DT.

Step 3 – Field Dispatch: Instead of dispatching a crew with a general instruction to “investigate a fault on Feeder X,” the control room dispatches a crew to a specific location – the section of feeder identified by the fault location analysis – with information about the type of fault event that was recorded. The crew arrives prepared for what they are likely to find.

Step 4 – Isolation and Restoration: In networks with automated switching, isolation of the faulted section and restoration to unaffected consumers may be completed remotely before the field crew arrives. In networks without full automation, the precise fault location data still significantly reduces the time the crew spends physically locating the fault before they can begin repair.

Step 5 – Restoration Verification: When supply is restored, smart meters in the previously affected area send power-on notifications. The monitoring platform confirms restoration automatically – the control room can see, in real time, which meters have supply back and which do not, without relying on field crew reports or consumer callbacks.

This five-step data-to-action workflow is what real-time grid monitoring actually delivers in operational terms. It is not a theoretical improvement – it is a measurable reduction in MTTR that DISCOMs implementing IoT-based grid monitoring consistently report once their systems are fully operational.

Distribution Automation India: The AT&C Loss Connection

The connection between IoT smart grid integration and AT&C loss reduction goes beyond outage management. Real-time network visibility enables a range of loss-reduction capabilities that are simply not possible without continuous, granular monitoring data.

Energy Balancing and Loss Localisation

When smart meters are deployed at the consumer level and DT meters are deployed at the transformer level, the monitoring system can continuously compare the energy measured at each DT against the sum of energy measured by all meters connected downstream. Any consistent gap between these two figures indicates a loss – whether technical (cable losses, transformer no-load losses) or commercial (theft, unbilled connections, meter bypass).

The ability to perform this energy balance calculation at the DT level – not just at the substation or feeder level – localises loss to specific sections of the network. Instead of knowing that a DISCOM has 18 percent AT&C losses overall, the utility knows that Transformer X on Feeder Y has a 35 percent loss gap and Transformer Z on the same feeder has a 4 percent loss gap. That precision transforms loss reduction from a general programme into a targeted, prioritised intervention effort.

Tamper Detection and Theft Identification

Smart meters connected to an IoT monitoring platform generate tamper event logs in real time – cover open events, magnetic field interference detections, neutral disturbance alerts, and load profile anomalies that suggest meter bypass. When these events are correlated with energy balance data from the relevant DT, the monitoring system can identify not just that a tamper event occurred, but whether it correlates with an unexplained increase in the DT’s loss gap – providing evidence of commercial loss at a specific meter point.

This evidence-based approach to theft identification is fundamentally more efficient than the traditional inspection-based approach, where field teams conduct periodic random checks across the network with limited ability to prioritise which consumers to inspect.

Smart Grid Reliability: What Good Looks Like for Indian DISCOMs

The operational performance improvements that IoT-based smart grid integration enables can be measured against a set of industry-standard reliability metrics that DISCOMs and regulators use to assess distribution network performance:

  • SAIDI (System Average Interruption Duration Index): The average total duration of supply interruptions per consumer per year. IoT-based fault detection and automated switching directly reduce SAIDI by shortening both fault location time and restoration time.
  • SAIFI (System Average Interruption Frequency Index): The average number of supply interruptions per consumer per year. Predictive maintenance enabled by continuous DT and feeder monitoring reduces the frequency of unplanned failures – directly improving SAIFI.
  • CAIDI (Customer Average Interruption Duration Index): The average duration of each interruption experienced by consumers. Faster fault location and dispatch reduces CAIDI even when interruptions cannot be prevented.
  • AT&C Loss Percentage: Real-time energy balancing and tamper detection directly reduce commercial losses, while improved fault management reduces the duration of periods during which unmetered supply creates technical loss accounting gaps.

DISCOMs that have implemented comprehensive IoT-based grid monitoring consistently report improvements across all four of these metrics within the first 12 to 24 months of full system operation. The improvements are not marginal – utilities that move from complaint-driven outage detection to real-time IoT monitoring typically see MTTR reductions of 40 to 60 percent in the first year, with ongoing improvements as the analytics layer matures.

Smart Energy Management: Integrating Renewables and Managing Demand

The benefits of IoT smart grid integration extend beyond outage management and fault detection into the broader challenge of smart energy management for a grid that is increasingly complex. As rooftop solar proliferates, as EV charging loads emerge on distribution feeders, and as demand-side management programmes become operational priorities, real-time grid visibility becomes the enabling foundation for all of these capabilities.

A DISCOM with full IoT monitoring across its network can see, in real time, the impact of rooftop solar generation on feeder voltage profiles – and respond proactively to voltage rise events that can affect power quality and equipment reliability. It can identify which feeders are approaching capacity limits during peak EV charging periods and make data-driven decisions about network reinforcement priorities. And it can implement demand response programmes that target specific consumer groups based on real-time load data – rather than broad, blunt interventions that affect the entire network.

These capabilities are not futuristic. They are available today, through the integration of smart metering data, IoT sensor networks, and advanced analytics platforms. The DISCOMs that build this foundation now will be the ones positioned to manage the energy transition effectively as India’s distribution grid becomes progressively more complex over the next decade.

For utilities looking to understand how smart grid integration technology can be applied to their specific network challenges, the combination of IoT sensor deployment, data architecture, and analytics capability is what determines how quickly that operational transformation becomes real.

Implementation Considerations: Building an IoT-Ready Grid

For DISCOMs planning IoT-based smart grid integration, the implementation pathway involves decisions across several dimensions:

Start With the Data Foundation

IoT smart grid integration is ultimately a data problem. The sensors generate the data, but the value is created by the systems that collect, process, and analyse it. Before deploying field devices, DISCOMs should ensure that their Head-End System, MDMS, and Distribution Management System are architected to receive and process data from IoT devices at scale – and that the analytics layer is designed to generate actionable insights, not just data dashboards.

Deploy in Layers

Full IoT grid integration does not need to happen all at once. A phased approach – starting with consumer smart meters and DT monitoring, then adding feeder fault indicators, then progressing to automated switching – allows the utility to build operational experience with real-time data at each stage before adding the next layer of complexity.

Invest in Control Room Capability

The operational value of real-time grid monitoring depends on the control room’s ability to interpret and act on the data it receives. This requires investment in operator training, upgraded SCADA and DMS software, and well-designed alerting systems that present the most critical information clearly and actionably – rather than overwhelming operators with raw data streams.

Integrate Across Systems

The full value of IoT smart grid data is only realised when it flows across the utility’s operational systems – from the monitoring platform to the outage management system, to the work order management system, to the billing and ERP platforms. System integration is often the most complex and time-consuming aspect of smart grid implementation, and it requires early, detailed planning to avoid the data silos that prevent end-to-end operational benefit.

The depth of experience required to navigate these implementation decisions across diverse utility environments is exactly what Probus brings to smart grid integration projects – from initial network assessment through to system commissioning and operational support. And for utilities wanting to understand how AMR devices and grid sensors work together as a unified sensing layer, the journey from basic metering to full grid intelligence is explored in detail in our blog on how 4G AMR devices become distribution sensors.

Conclusion

India’s distribution sector is at a defining moment. The investments being made today under RDSS – in smart meters, communication infrastructure, and data systems – are laying the foundation for a fundamentally different kind of grid: one that is visible, intelligent, and responsive in real time.

IoT-based smart grid integration is what turns that foundation into operational capability. It is what transforms smart meters from billing devices into grid sensors. It is what makes outage detection instantaneous rather than complaint-driven. It is what enables fault location to be data-directed rather than field-discovered. And it is what makes predictive maintenance – catching the DT that is about to fail before it does – a reality rather than an aspiration.

For DISCOMs, the operational and financial case for IoT-based grid monitoring is clear and well-evidenced. Faster outage restoration. Reduced AT&C losses. Lower field operations costs. Improved regulatory compliance metrics. Better consumer service. These are not theoretical outcomes – they are the documented results of utilities that have made the investment in real-time grid visibility and built the operational capability to act on what they see.

The question for every DISCOM is not whether IoT smart grid integration is worth pursuing. It is how to sequence the investment, design the right architecture, and build the operational capability to get the most out of it. If your organisation is working through any part of that journey, the Probus team is ready to help – with the technology, the integration expertise, and the field experience to turn real-time grid data into real operational results.


PLC vs RF Mesh vs 4G: Which Communication Technology Is Right for Your AMI Network?

When a DISCOM or utility embarks on a smart metering deployment, the technology decision that generates the most debate – and carries the most long-term consequence – is rarely the meter itself. It is the communication network that connects those meters to the Head-End System.

Get the communication technology right, and your AMI network becomes a reliable, scalable data highway that supports billing accuracy, loss detection, outage management, and demand analytics for years to come. Get it wrong, and you spend the operational life of the deployment firefighting connectivity issues, data gaps, and coverage failures that no amount of field troubleshooting can fully resolve.

The three technologies at the centre of every AMI communication technology decision in India today are Power Line Communication (PLC), Radio Frequency Mesh (RF Mesh), and 4G cellular. Each has genuine strengths. Each has real limitations. And for most large deployments, the answer is not a simple either/or – it is a considered, site-specific choice that may well involve combining two or more of these technologies in a hybrid architecture.

This blog provides a clear, honest breakdown of all three – what each technology does, where it performs best, where it struggles, and how to think about the decision for your specific AMI deployment context.

Why AMI Communication Technology Matters So Much

The smart meter sitting at a consumer’s premises is a sophisticated device. It measures interval consumption, detects tamper events, logs power quality parameters, supports remote connect and disconnect, and manages prepaid balances. But all of that intelligence is only useful if the data it generates can reliably reach the Head-End System – and if the commands from the HES can reliably reach the meter.

The communication network is the nervous system of the entire smart metering system. A meter that cannot communicate is, operationally, no better than a conventional analog device. And in a deployment of hundreds of thousands of meters, even a 5 percent communication failure rate means tens of thousands of meters generating no usable data – a material problem for billing, loss detection, and regulatory reporting.

This is why the communication technology decision deserves the same rigour and attention as the meter hardware decision – and why it should be made based on a clear understanding of each technology’s characteristics rather than on the basis of vendor preference, cost alone, or the assumption that what worked in one geography will work equally well in another.

Power Line Communication (PLC): Using the Grid as the Network

Power Line Communication is the oldest and most widely deployed AMI communication technology globally. The concept is elegant: instead of building a separate communication network, PLC uses the existing electricity distribution infrastructure – the power cables that already connect every meter to the grid – as the communication medium. High-frequency data signals are superimposed on the low-frequency power signal and propagated along the distribution network to concentrators typically installed at the Distribution Transformer.

How PLC Works in an AMI Context

In a PLC-based AMI deployment, each smart meter is equipped with a PLC modem that transmits data along the power line to a Data Concentrator Unit (DCU) installed at the DT. The DCU aggregates data from all meters connected to that transformer and forwards it to the Head-End System via a backhaul connection – typically GPRS, 4G, or ethernet. Commands from the HES follow the reverse path.

Two PLC standards are primarily used in Indian smart metering deployments: G3-PLC and PRIME. Both operate in the CENELEC A band (3–95 kHz) and support mesh networking, which allows meters to relay signals for other meters that cannot communicate directly with the DCU – improving coverage in topologically complex networks.

Where PLC Performs Well

  • Dense urban networks: In urban areas with short cable runs between DT and consumers, PLC signal propagation is reliable and consistent. The technology is well-proven in high-density residential deployments.
  • No dependency on external infrastructure: PLC operates entirely on the DISCOM’s own infrastructure. There is no reliance on third-party mobile networks or radio spectrum – which means no recurring SIM costs, no cellular coverage dependency, and no exposure to mobile network outages.
  • Lower per-meter communication cost: Once the DCUs are installed, the incremental cost of adding meters to the network is relatively low, making PLC economical for high-density deployments.
  • Integration with DT metering: Because the DCU sits at the DT, PLC naturally supports the DT-level energy balancing that is central to AT&C loss analytics – a significant operational advantage for DISCOMs focused on loss reduction.

Where PLC Struggles

  • Network noise: Power distribution networks carry electrical noise generated by variable loads – air conditioners, inverters, industrial equipment, and LED drivers. This noise degrades PLC signal quality and can cause data loss, particularly during peak load periods when noise levels are highest.
  • Long cable runs: In rural and peri-urban areas where DTs serve consumers spread over long distances, PLC signal attenuation over extended cable lengths reduces communication reliability. Coverage planning must account carefully for cable topology.
  • Network topology changes: Changes to the distribution network – new connections, cable replacements, switch operations – can affect PLC signal paths. The network must be revalidated after significant topology changes.
  • Lower data throughput: PLC bandwidth is limited compared to cellular technologies. While adequate for meter reading and basic commands, it constrains the volume and frequency of data that can be transmitted – a factor to consider as data requirements grow.

RF Mesh: A Self-Healing Wireless Network for AMI

Radio Frequency Mesh networking creates a wireless communication infrastructure specifically designed for smart metering. In an RF Mesh network, each smart meter is both a data endpoint and a network node – it can receive and transmit its own data, and it can also relay data for neighbouring meters that are too far from a gateway to communicate directly. This multi-hop relay capability is what makes RF Mesh a self-healing network: if one node loses connectivity, the network automatically routes around it through alternative paths.

How RF Mesh Works in an AMI Context

RF Mesh systems typically operate in unlicensed sub-GHz frequency bands – 865–867 MHz in India – which offer better building penetration and range than 2.4 GHz Wi-Fi frequencies. Data collectors or field area network (FAN) gateways are installed at intervals across the deployment area, and meters communicate in a mesh topology to these gateways, which forward data to the HES via cellular or fibre backhaul.

The mesh topology means that coverage is not binary – it does not simply work or fail. Instead, it degrades gracefully: as meters further from a gateway relay through increasing numbers of hops, latency increases but connectivity is maintained. This self-healing characteristic makes RF Mesh inherently more resilient to individual node failures than point-to-point communication architectures.

Where RF Mesh Performs Well

  • Dense urban and suburban residential deployments: RF Mesh thrives in areas where meters are in close enough proximity to form a dense, robust network. High meter density means more relay nodes and more alternative routing paths – which makes the network more reliable.
  • Independence from power line quality: Unlike PLC, RF Mesh is completely unaffected by power line noise or network topology changes. Communication quality depends on radio propagation, not power infrastructure quality.
  • Higher data throughput: RF Mesh supports higher data rates than PLC, making it better suited to deployments where frequent interval data, firmware-over-the-air (FOTA) updates, or richer meter event data are priorities.
  • Flexible deployment topology: RF Mesh does not require a specific distribution network topology – it works across any physical layout, making it suitable for areas where the power network topology does not map cleanly to the metering network requirements.

Where RF Mesh Struggles

  • Low meter density areas: In rural or sparsely populated areas where meters are far apart, the mesh network becomes thin – fewer relay nodes, fewer alternative paths, and higher risk of coverage gaps. RF Mesh is a poor fit for low-density rural deployments.
  • Physical obstructions: Reinforced concrete buildings, dense urban canyons, and underground meter installations can attenuate radio signals significantly – requiring additional gateway infrastructure to maintain coverage.
  • Gateway infrastructure cost: While per-meter costs are comparable to PLC, the gateway infrastructure required to provide backhaul for the mesh network adds deployment cost and complexity, particularly in geographically large service areas.
  • Spectrum management: Operating in unlicensed spectrum means RF Mesh networks share frequency bands with other devices. While sub-GHz bands are less congested than 2.4 GHz, spectrum interference is a consideration in some deployment environments.

4G Cellular: Direct Connectivity Over the Mobile Network

4G cellular communication takes a fundamentally different architectural approach to AMI connectivity. Instead of building a local area network among meters, each smart meter connects directly and independently to the Head-End System via the national 4G mobile network using a SIM card. There is no local mesh, no DCU at the DT, and no dependency on the power distribution network as a communication medium.

How 4G Works in an AMI Context

Each meter is fitted with a cellular modem and a SIM – either a physical SIM or an eSIM – and communicates with the HES over the standard 4G data network. This is the same network infrastructure used by smartphones and IoT devices. Data is transmitted directly from meter to HES without any intermediate aggregation nodes, giving each meter an independent, direct communication path.

Newer variants of this approach – particularly NB-IoT (Narrowband IoT) and LTE-M – are purpose-built low-power wide-area (LPWA) cellular standards optimised for IoT devices with low data rate requirements, long battery life needs, and deep building penetration requirements. These are increasingly being specified for smart metering deployments as an alternative to standard 4G.

Where 4G Performs Well

  • Rapid deployment in areas with good cellular coverage: 4G requires no local network infrastructure – no DCUs, no RF gateways. Where cellular coverage exists, meters can be deployed and communicating immediately, making it the fastest technology to roll out at scale in well-covered areas.
  • Rural and geographically dispersed deployments: In areas where meter density is too low for RF Mesh and cable run distances are too long for reliable PLC, 4G provides coverage that the other technologies cannot match – as long as cellular signal is available.
  • High data throughput and low latency: 4G offers the highest data rates and lowest latency of the three technologies – enabling near real-time data collection, fast command response, and support for future high-bandwidth applications.
  • Simplicity of architecture: The absence of local network infrastructure simplifies deployment planning, reduces on-site installation complexity, and eliminates the need to manage DCU or gateway hardware in the field.

Where 4G Struggles

  • Recurring SIM and data costs: Every meter requires a SIM with an active data plan. Across a deployment of hundreds of thousands of meters, these recurring costs add a significant long-term OPEX component that PLC and RF Mesh – which use owned infrastructure – do not carry.
  • Dependency on mobile network availability: 4G connectivity depends on the mobile operator’s network. Coverage gaps, network congestion during peak hours, and outages affect meter communication – and the DISCOM has no control over the underlying network infrastructure.
  • Coverage gaps in rural India: Despite significant expansion of 4G infrastructure across India, coverage in remote rural areas remains inconsistent. In areas that are both low-density (precluding RF Mesh) and poorly covered by cellular (limiting 4G), this creates a genuine coverage challenge.
  • Power dependency for communication: Because each meter connects independently, a power outage at the meter also means loss of communication – unless the meter has battery backup for last-gasp signalling. With PLC and RF Mesh, meters closer to power may relay for those that have lost supply.

Head-to-Head Comparison: PLC vs RF Mesh vs 4G

To make the comparison concrete, here is how the three technologies stack up across the dimensions that matter most for AMI deployment decisions:

Deployment Speed: 4G is the fastest to deploy – no local infrastructure required. RF Mesh requires gateway installation. PLC requires DCU installation at each DT.

Coverage in Dense Urban Areas: All three perform well. PLC and RF Mesh have slight advantages due to independence from cellular network quality.

Coverage in Rural Areas: 4G leads where cellular coverage exists. PLC can work if cable runs are manageable. RF Mesh is poorly suited to low-density rural environments.

Recurring Cost: PLC and RF Mesh have low recurring costs after infrastructure is deployed. 4G carries ongoing SIM and data costs per meter for the deployment lifetime.

Data Throughput: 4G is highest, RF Mesh is moderate, PLC is lowest of the three.

Resilience to Power Network Issues: RF Mesh and 4G are unaffected by power line noise. PLC performance is directly linked to power network quality.

Integration with DT Metering: PLC has a natural advantage – DCUs at the DT create a logical integration point. RF Mesh and 4G require separate DT meter communication paths.

Infrastructure Ownership: PLC and RF Mesh use owned infrastructure – the DISCOM or AMISP controls the network. 4G depends on a third-party mobile operator.

The Case for Hybrid AMI Communication Architecture

For most large DISCOM deployments – which span diverse geographies including dense urban centres, peri-urban areas, and rural peripheries – no single communication technology is optimal across the entire service territory. This is the practical reality that drives the growing adoption of hybrid AMI networks that combine two or more technologies based on the characteristics of each area.

A typical hybrid architecture for a large Indian DISCOM might look like this:

  • Dense urban areas: RF Mesh or PLC – leveraging the high meter density and reliable infrastructure for cost-effective, high-performance local area network coverage.
  • Peri-urban and semi-rural areas: PLC where power infrastructure quality supports it, supplemented by 4G for areas where cable run distances exceed PLC’s reliable range.
  • Sparse rural areas: 4G cellular – or NB-IoT where available – providing individual meter connectivity where neither PLC nor RF Mesh can achieve adequate coverage.

The key to making a hybrid architecture work is ensuring that the Head-End System and MDMS are designed from the outset to handle data from multiple communication technologies – normalising and processing data regardless of the path through which it arrived. This is a non-trivial system design challenge, but it is entirely achievable with the right architecture and the right implementation partner.

The ability to design, deploy, and operate multi-protocol AMI networks across varied Indian geographies is central to how Probus approaches smart grid integration – combining patented communication technology with deep field experience across diverse deployment environments.

How to Make the Right AMI Communication Decision for Your Network

For DISCOM technical teams and programme managers working through this decision, here is a structured framework for evaluating which technology – or combination of technologies – is right for your AMI network:

Step 1 – Map Your Service Territory

Start with a detailed characterisation of your service area: the distribution of consumer density across urban, peri-urban, and rural zones; the quality and topology of your low-voltage distribution network; existing cellular coverage maps from major operators; and the physical environment – building density, terrain, and any factors likely to affect radio propagation.

Step 2 – Define Your Data Requirements

What data do you need to collect, at what frequency, and with what latency? Fifteen-minute interval reads for billing and loss analytics have different requirements from near real-time outage detection or FOTA updates for meter firmware. Higher data rate requirements favour RF Mesh or 4G over PLC.

Step 3 – Model the Total Cost of Ownership

Capital cost comparisons between technologies can be misleading without accounting for total cost of ownership over the contract term. Include infrastructure hardware (DCUs, gateways), installation costs, SIM and data costs for 4G, ongoing maintenance, and the cost of coverage gaps – unmeasured meters that affect billing and loss analytics.

Step 4 – Conduct Technology Pilots Before Full Rollout

No amount of desk-based analysis substitutes for field validation. Before committing to a communication technology for full-scale deployment, conduct pilots in representative areas of your service territory – dense urban, peri-urban, and rural – and measure actual communication performance against your target data collection efficiency.

Step 5 – Evaluate Your AMISP’s Communication Track Record

Your AMISP’s proposed communication technology should be evaluated not just on paper specifications but on actual deployment experience. Ask for references from comparable deployments – similar geography, similar meter density, similar network conditions. A technology that performed well in a different environment may not perform equivalently in yours.

Understanding the full picture of what a robust smart metering deployment requires – from communication architecture to data management – is essential for making decisions that hold up over the full deployment lifecycle, not just in the first year of operation.

IoT Energy Meters and the Future of AMI Communication

The communication technology landscape for AMI is not static. Several developments are shaping how the decision will look in two to three years:

NB-IoT and LTE-M maturation: These purpose-built cellular IoT standards offer better building penetration, lower power consumption, and lower per-device data costs than standard 4G. As Indian mobile operators expand their NB-IoT and LTE-M coverage, these technologies are becoming increasingly viable for smart metering applications – particularly for the deep-indoor and basement meter installations where standard 4G and RF Mesh struggle.

5G for grid applications: While 5G’s ultra-low latency and high bandwidth are most immediately relevant for real-time grid control applications rather than meter reading, 5G network slicing capabilities open up the possibility of dedicated, guaranteed-quality communication channels for critical grid communication – a development that will become increasingly relevant as smart grid infrastructure matures.

Multi-protocol HES platforms: Head-End Systems are evolving to natively support multiple communication protocols simultaneously – meaning that hybrid AMI networks become easier to manage as the software layer matures. This reduces one of the historical complexity barriers to hybrid deployment.

For IoT energy meter deployments and IoT electricity meter applications at scale, the direction is clearly towards greater flexibility – the ability to connect devices via whatever communication technology is optimal for their location, managed through a unified platform that abstracts the underlying protocol complexity.

This evolution is precisely what Probus’s smart grid integration capabilities are designed to support – providing utilities with the technology and expertise to build AMI networks that are not locked into a single communication approach, but flexible enough to adapt as both the technology landscape and the utility’s own network evolve.

Conclusion

PLC, RF Mesh, and 4G are each credible AMI communication technologies. None of them is universally superior. Each has a deployment context in which it performs best, a set of conditions under which it struggles, and a cost profile that makes it more or less appropriate depending on the scale and geography of the deployment.

The right answer for your AMI network depends on where your meters are, what your power infrastructure looks like, what data you need and how often, and what your long-term cost position needs to be. For most large Indian DISCOMs, that answer will involve a combination of technologies – a hybrid architecture that assigns the right communication approach to each part of the service territory rather than forcing a single technology to perform across conditions it was not designed for.

Getting this decision right at the outset avoids years of operational headaches and data quality problems downstream. Getting it wrong means managing around fundamental connectivity limitations for the entire duration of the deployment contract – typically eight to ten years.

If your DISCOM or AMISP is working through the AMI communication technology decision for an upcoming deployment, speak with the Probus team. We have designed and deployed AMI communication networks across a range of Indian geographies and network conditions, and we can help you build the architecture that delivers the data collection performance your smart metering programme depends on.

Smart Metering Rollout Under RDSS: What Every DISCOM Needs to Know in 2026

The Revamped Distribution Sector Scheme – RDSS – is the most consequential electricity distribution reform India has launched in a generation. With a total outlay of over ₹3 lakh crore and a mandate to modernise the country’s creaking distribution infrastructure, it sits at the centre of India’s energy transition ambitions. And at the heart of the RDSS is one technology: smart metering.

By the time the scheme reaches its full implementation targets, over 250 million smart meters are expected to be deployed across India – covering agricultural, domestic, commercial, and industrial consumers, as well as Distribution Transformers and feeders. For DISCOMs, this is not a distant policy goal. The rollout is already underway. Targets are being assigned. Timelines are being enforced. And the decisions that DISCOM leadership makes about how to approach their RDSS smart meter rollout in 2026 will determine whether their deployment delivers its promised returns or becomes a costly, complicated, and delayed programme that falls short of expectations.

This blog is a practical guide to what every DISCOM needs to understand about smart metering under RDSS in 2026 – from the scheme’s structure and requirements to the implementation decisions that most significantly affect outcomes.

Understanding RDSS: The Policy Framework Driving Smart Metering in India

The RDSS was notified by the Ministry of Power in July 2021, replacing the earlier Integrated Power Development Scheme (IPDS) and Deen Dayal Upadhyaya Gram Jyoti Yojana (DDUGJY). Its objectives are direct: reduce AT&C losses to below 12 percent at the national level, eliminate the gap between the Average Cost of Supply and Average Revenue Realised, and upgrade the distribution infrastructure to support a modern, reliable grid.

Smart metering is not a peripheral component of RDSS – it is a central pillar. The scheme’s guidelines require DISCOMs to deploy smart prepaid meters for all consumers with a monthly consumption above 50 units, as well as smart DT meters and feeder meters. The deployment is to be carried out through the Advanced Metering Infrastructure Service Provider (AMISP) model, under which private entities finance, supply, install, operate, and maintain the metering infrastructure on a long-term OPEX basis.

Understanding this AMISP structure is fundamental to understanding how RDSS smart metering deployment actually works in practice – and where the risks and responsibilities lie for each party involved.

The AMISP Model: What DISCOMs Are Actually Signing Up For

Under the AMISP framework, the DISCOM does not procure smart meters as a capital asset. Instead, it enters into a long-term service agreement – typically 8 to 10 years – with an AMISP that is responsible for the entire metering lifecycle: device procurement, installation, communication network deployment, Head-End System (HES) operation, and meter data management.

The DISCOM pays a monthly service charge per meter – a per-meter-per-month (PMPM) rate – and receives metering data and services in return. The AMISP bears the capital expenditure and the operational risk of the system’s performance.

This model has significant advantages for DISCOMs facing capital constraints: it converts a large upfront CAPEX into a predictable OPEX commitment, and it transfers the technical complexity of AMI deployment and operation to a specialist service provider. But it also comes with important contractual and governance considerations that DISCOMs must manage carefully:

  • Service Level Agreements (SLAs): The PMPM contract must be structured around clear, enforceable performance metrics – meter uptime, data collection efficiency, fault resolution timelines, and system availability. Poorly defined SLAs are one of the most common causes of AMISP deployments failing to deliver expected value.
  • Data ownership and access: The DISCOM must retain full ownership of and unrestricted access to all metering data generated by the system – including raw interval data, tamper events, and outage records. This is a non-negotiable requirement that must be explicitly defined in the contract.
  • Integration with DISCOM systems: The AMISP’s HES and MDMS must integrate cleanly with the DISCOM’s existing billing, ERP, and outage management systems. Integration architecture and data exchange protocols must be specified at the contract stage, not resolved after deployment begins.
  • Exit provisions: The contract must define what happens to the metering infrastructure, data, and systems at the end of the term or in the event of early termination – protecting the DISCOM’s continuity of operations.

DISCOMs that treat the AMISP tender and contract process as a procurement formality – rather than a strategic decision with long-term operational consequences – tend to encounter avoidable problems during deployment and operation.

Advanced Metering Infrastructure India: The Technical Architecture DISCOMs Must Understand

The advanced metering infrastructure that underpins RDSS smart metering is a multi-layer technical system. DISCOM leadership and technical teams do not need to be experts in every component – but they do need to understand the architecture well enough to ask the right questions of their AMISP and to evaluate whether what is being proposed will actually meet their operational needs.

The AMI stack consists of three layers:

Layer 1 – The Meter

Smart meters deployed under RDSS must comply with Bureau of Indian Standards specifications – primarily IS 16444 for single-phase and IS 15959 for three-phase meters. They must support two-way communication, remote connect/disconnect, interval data logging, tamper detection, and prepaid functionality. They must also comply with DLMS/COSEM communication standards, which govern how meter data is structured and exchanged.

BIS certification is mandatory. DISCOMs should verify that the meters proposed by their AMISP carry current, valid BIS certification – not provisional approvals or meters that were certified under earlier specifications that may not fully comply with current RDSS requirements.

Layer 2 – The Communication Network

Smart meters communicate their data to the Head-End System via a communication network. The three primary technologies used in Indian AMI deployments are Power Line Communication (PLC), Radio Frequency (RF) Mesh, and 4G cellular. Each has distinct characteristics in terms of range, bandwidth, infrastructure cost, and suitability for different network environments.

PLC uses the existing electricity distribution network as a communication medium – cost-effective in areas with good power infrastructure but susceptible to network noise. RF Mesh creates a self-healing wireless network among meters – effective in dense urban deployments. 4G cellular connects meters directly to the HES over the mobile network – flexible and fast to deploy but carries ongoing SIM and data costs.

Many large RDSS deployments use a hybrid communication architecture – combining two or more of these technologies to optimise coverage and cost across different parts of the service territory. DISCOMs should ensure that the communication technology their AMISP proposes is appropriate for the specific geographic and network conditions of their service area, not simply the technology that the AMISP’s preferred vendor supplies.

Layer 3 – The Head-End System and MDMS

The Head-End System (HES) is the server-side platform that communicates with the meters, collects data, and passes it to the Meter Data Management System (MDMS). The MDMS processes, validates, stores, and distributes the data to downstream systems including billing, ERP, and outage management.

This is where the operational value of smart metering is actually realised – and it is the layer that DISCOMs most commonly underestimate in importance. The best meters in the world, connected by the most reliable communication network, deliver no operational benefit if the HES and MDMS are poorly implemented, inadequately integrated with DISCOM systems, or unable to scale to the volume of data the deployment generates.

Understanding the full smart metering stack – from device to data – is central to how Probus approaches smart metering solutions for DISCOMs, ensuring that the intelligence layer is designed and integrated from the outset rather than treated as an afterthought.

Key Compliance Requirements Under RDSS: A Checklist for DISCOMs

Beyond the technology architecture, RDSS smart metering deployments must meet a range of compliance requirements that DISCOMs are responsible for – even when the deployment is managed by an AMISP. Here are the critical compliance areas every DISCOM programme team should have on its radar:

  • BIS meter certification: All smart meters must carry valid BIS certification under the relevant IS standards. The DISCOM’s quality assurance process should include factory acceptance testing (FAT) to verify that delivered meters match certified specifications.
  • DLMS/COSEM compliance: Meter communication must comply with DLMS/COSEM standards. This is mandatory for interoperability and is a specific RDSS requirement that enables DISCOM systems to communicate with meters from different manufacturers if needed.
  • Data security: The RDSS guidelines require that metering data be encrypted both in transit and at rest. The AMISP’s cybersecurity architecture must be reviewed and verified – not simply accepted on the basis of the AMISP’s assurances.
  • Consumer communication: Smart meter installation, particularly prepaid smart meters, has consumer communication requirements. DISCOMs must plan and execute consumer awareness programmes to reduce installation refusals and post-installation complaints – a factor that significantly affects rollout timelines in practice.
  • Feeder and DT metering: RDSS requires not only consumer-level smart metering but also smart meters at the Distribution Transformer and feeder level. The DT and feeder metering infrastructure is what enables energy balancing and AT&C loss analytics – deploying consumer meters without the upstream DT and feeder meters significantly limits the scheme’s loss reduction effectiveness.
  • State Electricity Regulatory Commission (SERC) alignment: Prepaid metering, time-of-use tariffs, and smart meter data usage policies are subject to SERC jurisdiction. DISCOMs must ensure that their deployment plans align with applicable SERC orders and that any tariff-related functionality enabled by smart meters has the required regulatory clearance.

Common Deployment Challenges – and How to Get Ahead of Them

DISCOMs that have already initiated RDSS smart metering deployments have encountered a consistent set of challenges. Understanding these in advance – and building mitigation strategies into the programme plan – significantly improves the likelihood of a successful rollout.

Consumer Resistance and Installation Refusals

In many states, particularly where prepaid metering is perceived negatively by consumers, installation refusals have been a significant constraint on rollout pace. Consumers who associate smart meters with automatic disconnection or higher bills resist installation – sometimes actively, sometimes passively by simply not being available for the installation appointment.

The solution is proactive consumer communication – explaining clearly what the smart meter does, how the prepaid system works, and what benefits the consumer receives – delivered through local language campaigns, DISCOM staff engagement, and community-level outreach before the installation team arrives. DISCOMs that invest in consumer communication consistently achieve faster installation progress than those that treat it as a secondary concern.

Last-Mile Connectivity Gaps

Communication coverage – particularly in semi-urban and rural areas – is rarely as reliable in practice as it appears in pre-deployment surveys. RF mesh networks may struggle in areas with complex building layouts. PLC performance may be degraded by poor power infrastructure quality. 4G coverage may be spotty in some districts.

DISCOMs must require their AMISP to conduct rigorous pilot testing in representative areas before full-scale rollout – and to have contingency communication solutions identified for areas where the primary technology does not achieve adequate coverage.

Integration Delays with Legacy Billing Systems

The integration between the AMISP’s MDMS and the DISCOM’s billing system is frequently the most technically complex and time-consuming aspect of a smart metering deployment. Many DISCOMs operate billing systems that were not designed to ingest interval data, and the API development and testing required to integrate the two systems can take months if not planned and resourced properly from the outset.

DISCOMs should require the AMISP to present a detailed integration architecture and timeline at the contract stage – and should resource their own IT teams to actively participate in the integration process, rather than treating it as solely the AMISP’s responsibility.

Programme Governance and Performance Tracking

Large smart metering programmes involve multiple stakeholders – AMISP, DISCOM programme team, meter manufacturers, communication equipment suppliers, field installation contractors, and IT system integrators. Without strong programme governance – clear accountability, regular review cadences, escalation paths, and performance dashboards – coordination failures compound into significant delays.

DISCOMs should establish a dedicated smart metering programme management office (PMO) with executive-level sponsorship and clear authority to make and enforce decisions across all workstreams. This is not overhead – it is the single most important structural factor in determining whether a large deployment stays on track.

What Smart Metering Under RDSS Actually Delivers When Done Right

Amid the complexity of RDSS compliance, AMISP contracting, and technical architecture decisions, it is worth stepping back and being clear about what successful smart metering deployment actually delivers for a DISCOM – because the benefits are substantial and transformative when the programme is executed well.

  • AT&C loss reduction: Energy balancing between DT meters and consumer meters identifies loss hotspots with precision. DISCOMs that have deployed full AMI stacks – including feeder, DT, and consumer meters – consistently report significant AT&C loss reductions within the first 12 to 18 months of full operation.
  • Billing accuracy and revenue recovery: Eliminating estimated billing and enabling accurate, timely bill generation recovers revenue that was previously lost to billing inefficiency. For a large DISCOM with millions of consumers, even a modest improvement in billing accuracy translates into hundreds of crores in annual revenue improvement.
  • Reduced field operations cost: Remote meter reading, remote connect/disconnect, and automated tamper detection reduce the field operations burden on DISCOM staff – freeing capacity for higher-value work and reducing the cost of consumer service operations.
  • Improved consumer service: Smart meters enable consumers to track their consumption, manage their prepaid balance, and receive outage notifications – improving service quality without increasing the burden on DISCOM call centres.
  • Foundation for grid modernisation: The data infrastructure built for smart metering – AMI communication network, HES, MDMS – is also the foundation for broader smart grid integration capabilities including demand response, distributed energy resource management, and predictive maintenance.

2026: The Year That Will Define RDSS Smart Metering Outcomes

The RDSS has set ambitious milestones. The Ministry of Power has been clear that financial assistance under the scheme is linked to performance – DISCOMs that do not meet their deployment targets risk losing access to scheme funding. This creates real urgency for DISCOMs that have been slow to initiate their smart metering programmes or have encountered early-stage deployment delays.

At the same time, the DISCOMs that have already deployed smart meters at meaningful scale are beginning to see the data that validates the scheme’s promise – measurable reductions in AT&C losses, improved billing recovery, and early signals of the operational transformation that full AMI deployment enables.

2026 is the year in which the gap between these two groups of DISCOMs – those executing well and those struggling – will become clearly visible. And the decisions made in the next six to twelve months about programme governance, AMISP management, technical architecture, and consumer communication will determine which side of that divide each DISCOM finds itself on.

For DISCOMs navigating the complexity of their smart metering systems deployment under RDSS – whether at the planning stage, mid-rollout, or addressing early-stage challenges – working with a partner that understands both the technology and the operational realities of large-scale Indian deployments is critical. Probus has been part of some of India’s most demanding smart meter deployment programmes, bringing technical depth and field experience to every engagement.

Conclusion

The RDSS smart metering mandate is clear, the timelines are firm, and the financial stakes – both the funding available through the scheme and the revenue at risk from continued AT&C losses – are substantial. For every DISCOM in India, the question is not whether to deploy smart meters. It is how to deploy them in a way that delivers the operational transformation the scheme is designed to enable.

That means understanding the AMISP model deeply. It means designing the right AMI architecture for your service territory. It means managing consumer communication proactively. It means building the programme governance to keep a complex, multi-stakeholder deployment on track. And it means treating the data infrastructure – HES, MDMS, and system integration – as seriously as the meters themselves.

DISCOMs that get these decisions right in 2026 will be the ones looking back in 2028 at a transformed distribution business – one that knows where its energy is going, bills accurately, recovers revenue efficiently, and has the data foundation to keep modernising. If you are working through any of these decisions for your DISCOM’s smart metering programme, the Probus team is ready to help – with the technical expertise and deployment experience to support your programme from planning through to operation.

How Wireless Solar String Monitoring Reduces O&M Costs for Large-Scale Plants

India’s solar energy sector is scaling at a speed that few could have predicted even five years ago. Gigawatt-scale solar parks are becoming commonplace. Rooftop installations are multiplying across industrial and commercial rooftops. And with every megawatt commissioned, the pressure on operations and maintenance teams grows heavier.

Because here is the reality that every solar plant developer, IPP, and EPC contractor eventually confronts: installing a solar plant is one cost. Keeping it performing at its designed output, year after year, is another. And in India’s O&M landscape – where plants are large, geographically dispersed, and subject to aggressive dust, heat, and humidity – the gap between what a plant should generate and what it actually generates is often wider than it should be.

Wireless solar string monitoring is the technology that is closing that gap. Not by changing how solar panels work – but by giving O&M teams the data they need to find problems fast, act on them precisely, and stop revenue from bleeding away undetected. This blog explains how it works, why it matters for large-scale plants specifically, and what the real-world impact on O&M costs looks like.

Why Large-Scale Solar Plants Face a Unique O&M Challenge

A rooftop solar system of 50 kW can be physically inspected end-to-end in an afternoon. A ground-mounted solar power plant of 50 MW cannot. The sheer physical scale of utility-grade installations – spanning dozens or hundreds of hectares, with tens of thousands of individual modules connected across hundreds of strings – makes manual inspection both time-consuming and fundamentally inadequate as a primary fault detection strategy.

Yet this is exactly how the majority of large solar plants in India are maintained today. Periodic site visits. Scheduled cleaning rounds. Reactive maintenance triggered when an inverter alarm becomes impossible to ignore. The result is a systematic delay between when a performance problem develops and when it is detected and resolved – and during that delay, generation loss accumulates quietly and consistently.

The numbers bear this out. Industry data from solar plants across India consistently shows that O&M-preventable losses – faults, soiling, degradation, and mismatch – account for somewhere between 8 and 20 percent of potential annual generation at plants relying on conventional monitoring approaches. For a 10 MW plant generating at a tariff of ₹3 per unit, even the lower end of that range represents significant annual revenue loss.

The challenge is not that plant operators do not want to do better. It is that without granular, continuous data from the field, they simply cannot see the problems that need solving.

What Is Solar String Monitoring – and Why Does the String Level Matter?

In a solar plant, panels are wired together in series to form strings. Multiple strings connect into a combiner box or directly into an inverter. The inverter aggregates the output of all connected strings and converts it to AC power for grid injection.

Conventional plant monitoring typically measures performance at the inverter level – meaning the data you see reflects the combined output of anywhere from 8 to 20 or more strings at once. If one of those strings is underperforming due to soiling, a faulty panel, shading, or degradation, the inverter-level data may not clearly reveal it. The underperforming string is averaged in with the healthy ones, and the aggregate number may still look broadly acceptable.

This is the fundamental limitation of inverter-level monitoring alone. String monitoring places measurement at the string level – each string’s current and voltage are measured individually, continuously, and compared against expected performance benchmarks. When a string deviates from its expected output by more than a defined threshold, an alert is triggered immediately.

The result: problems that would previously go undetected for weeks or months are identified within hours. And the O&M team knows exactly which string is affected, where it is physically located in the array, and what the data pattern suggests about the probable cause – before a technician ever sets foot on site.

Why Wireless Changes Everything for Large-Scale Deployment

String monitoring is not a new concept. Wired string monitoring systems have existed for years. But wired deployment at scale across a large solar power plant carries significant practical challenges: communication cables must be routed from each string combiner box back to a central data logger, conduit must be installed across the site, connections are exposed to heat, moisture, and rodent damage, and any cable fault requires field investigation to locate and repair.

In a plant of 20 MW or larger, the installation cost and long-term maintenance burden of a comprehensive wired monitoring network can be substantial – enough that many developers historically decided the economics did not justify it, particularly for plants that were already commissioned without wired monitoring infrastructure built in.

Wireless solar string monitoring removes all of these constraints. Compact, low-power wireless sensors are attached directly at the string or combiner box level. They communicate via radio frequency protocols to gateway nodes positioned across the plant – nodes that require only a power connection, not a cable run to every string. The gateways connect to the cloud monitoring platform over cellular or site broadband.

The installation of a wireless monitoring system across a large solar plant can be completed in a fraction of the time required for a wired equivalent, with no civil works, no conduit, and no disruption to plant operations. And crucially, it can be retrofitted onto existing plants – even those that have been operating for several years without string-level visibility.

This is the specific capability at the core of Probus’s solar monitoring solutions – patented wireless sensor technology engineered for the operating conditions and scale of India’s solar fleet, from large rooftop installations to utility-scale ground-mounted parks.

The Direct Impact on O&M Costs: Five Mechanisms

The cost savings from wireless solar string monitoring flow through five distinct channels. Understanding each of them helps build the honest business case for the investment.

1. Faster Fault Detection Reduces Cumulative Generation Loss

Every day a string fault goes undetected is a day of generation loss. A string producing at 70 percent of its expected output due to a faulty bypass diode or panel-level hotspot loses 30 percent of its contribution to the array for every hour it operates. With conventional monitoring, that fault might not be identified for two to four weeks – or until the next scheduled site visit. With wireless string monitoring, the alert is generated within the first monitoring cycle after the fault develops.

Compounding this across a large plant with multiple simultaneous low-level faults – which is the norm, not the exception, in mature solar installations – the difference in annual generation between monitored and unmonitored plants becomes very significant.

2. Data-Driven Cleaning Schedules Cut Labour and Water Costs

Cleaning is one of the largest recurring O&M costs for solar plants in India, particularly in dust-intensive regions. Most plants clean on a fixed schedule – every 7, 10, or 14 days – regardless of actual soiling levels. This means some strings are cleaned when they do not need it, while others accumulate soiling faster than the schedule anticipates.

Wireless string monitoring enables performance-based cleaning: O&M teams prioritise cleaning the strings showing the highest performance deviation due to soiling first, and defer cleaning strings still performing within tolerance. This optimisation typically reduces the total number of cleaning cycles required annually while improving the timing and targeting of those that are performed – cutting both water consumption and labour cost simultaneously.

3. Reduced Unplanned Site Visits Through Remote Diagnosis

In conventional O&M, many site visits are triggered by vague performance concerns – the plant seems to be underperforming based on aggregate data, so a team is dispatched to investigate. These investigation visits are expensive, time-consuming, and often inconclusive because the root cause is not clear until the team is on site.

With wireless string monitoring, the data tells the story before anyone leaves the office. An alert specifying which string is affected, what the deviation looks like, and how long it has been occurring allows O&M planners to determine remotely whether the issue requires an urgent dispatch or can be bundled into the next scheduled visit. Unplanned investigative visits are dramatically reduced, and when technicians are dispatched, they arrive prepared – with the right tools for the diagnosed fault.

4. Early Detection Prevents Expensive Equipment Damage

Some solar panel faults – particularly hotspots caused by partially shaded or degraded cells, and potential-induced degradation – worsen progressively if not addressed. A panel with a developing hotspot that is identified and replaced early costs far less than one that has been running hot for six months and has caused damage to adjacent cells or the module backsheet.

Wireless string monitoring’s ability to flag performance anomalies at the earliest stage means that maintenance interventions happen when they are still relatively minor and low-cost – rather than after a fault has had time to escalate into a more significant and expensive equipment issue.

5. Performance Benchmarking Strengthens Warranty and EPC Accountability

For plant owners managing PPA obligations and equipment warranties, string-level performance data is a powerful tool for accountability. If a specific string consistently underperforms relative to its neighbours despite cleaning and maintenance, the data provides evidence to support a warranty claim with the panel manufacturer. If a plant commissioned by an EPC contractor fails to meet its designed performance guarantee, string-level data allows the specific sources of underperformance to be isolated and attributed.

This accountability layer – which conventional monitoring simply cannot provide – has real financial value that is often overlooked in the O&M cost reduction conversation.

Installation of Photovoltaic Panels and the Right Time to Add Monitoring

The ideal moment to implement wireless string monitoring is at the time of commissioning – integrating the sensor hardware into the plant design from day one and establishing baseline performance benchmarks against which future data can be compared.

But the practical reality is that a large proportion of India’s existing solar fleet was commissioned without string-level monitoring. For these plants, the question is not whether to add monitoring – it is when and how. The answer, in almost every case, is: sooner rather than later.

The older a plant gets, the more likely it is to have developed performance issues that have been silently accumulating. Retrofitting wireless monitoring onto a plant that has been operating for three to five years typically surfaces a range of previously unknown faults and inefficiencies – the identification and resolution of which often pays for the monitoring system within the first year of operation.

For new plants under design, the conversation about solar O&M strategy and monitoring architecture should happen at the pre-installation stage – not after commissioning is complete. The choices made at that stage determine how visible the plant’s performance will be throughout its 25-year operating life.

What Good Wireless String Monitoring Looks Like in Practice

Not all wireless monitoring systems are created equal. For plant owners evaluating options, here are the capability markers that separate a genuinely useful system from one that generates data without delivering actionable intelligence:

  • String-level granularity: The system must measure at the individual string level – not at the combiner box level aggregating multiple strings – to provide the fault isolation precision that makes monitoring operationally useful.
  • Irradiance-corrected benchmarking: Performance deviations must be assessed against irradiance-adjusted expected output, not absolute values. A string generating less on a cloudy day is not underperforming – the analytics must account for this.
  • Automated alerting with fault classification: The platform should classify alerts by probable cause – soiling, shading, panel fault, string disconnect – to guide the O&M response without requiring manual data interpretation.
  • Historical trend analysis: The system should track string performance trends over time, enabling the identification of gradual degradation trajectories before they reach acute fault thresholds.
  • Portfolio dashboard: For operators managing multiple plants, a unified view across the portfolio – showing relative performance, active alerts, and O&M status – is essential for efficient resource allocation.

Connecting Solar Monitoring to the Broader Energy Intelligence Picture

Wireless solar string monitoring does not exist in isolation. For DISCOMs and utilities managing both generation assets and distribution infrastructure, the data from solar monitoring systems feeds into the same operational intelligence picture as grid monitoring, feeder data, and demand analytics. The convergence of these data streams – solar generation performance, grid load, and consumer demand – is where the real value of smart grid integration begins to be realised.

A DISCOM that can see, in real time, that a rooftop solar installation on a commercial feeder is underperforming – and correlate that with feeder load data – has a fundamentally better picture of its distribution network than one relying on periodic manual reports. This integration of generation and grid data is the direction that energy infrastructure management in India is heading, and solar string monitoring is one of the key data sources feeding into it.

Conclusion

The solar industry in India has solved the installation problem. The challenge now is performance – ensuring that the capacity already in the ground generates the energy it was designed to produce, year after year, at the lowest possible O&M cost.

Wireless solar string monitoring is the most direct and effective tool available to address that challenge for large-scale plants. It closes the visibility gap that conventional monitoring leaves open. It enables O&M teams to work from data rather than schedules and guesswork. And it delivers measurable cost reductions – through faster fault resolution, optimised cleaning, reduced site visits, and better equipment care – that compound over the lifetime of the plant.

For developers, IPPs, and O&M contractors managing large solar assets in India, the question is no longer whether wireless string monitoring is worth deploying. The question is how quickly it can be in place – because every month without it is a month of preventable loss.

To learn more about how Probus’s wireless solar string monitoring technology works for large-scale plants, or to discuss a retrofit deployment for an existing installation, reach out to our team – we are working with solar operators across India to make string-level visibility a standard part of every plant’s O&M strategy.