When smart grid hardware fails in the field, the cause is often attributed to electronics, firmware, or environmental exposure. In reality, many of these failures begin much earlier and much deeper in the system.
They begin at the power supply.
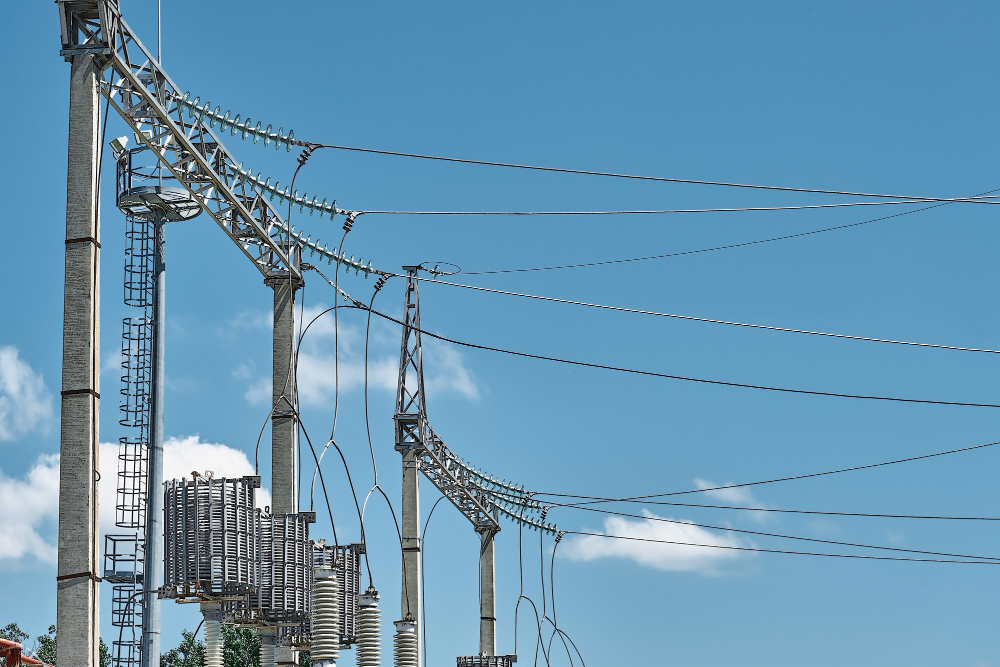
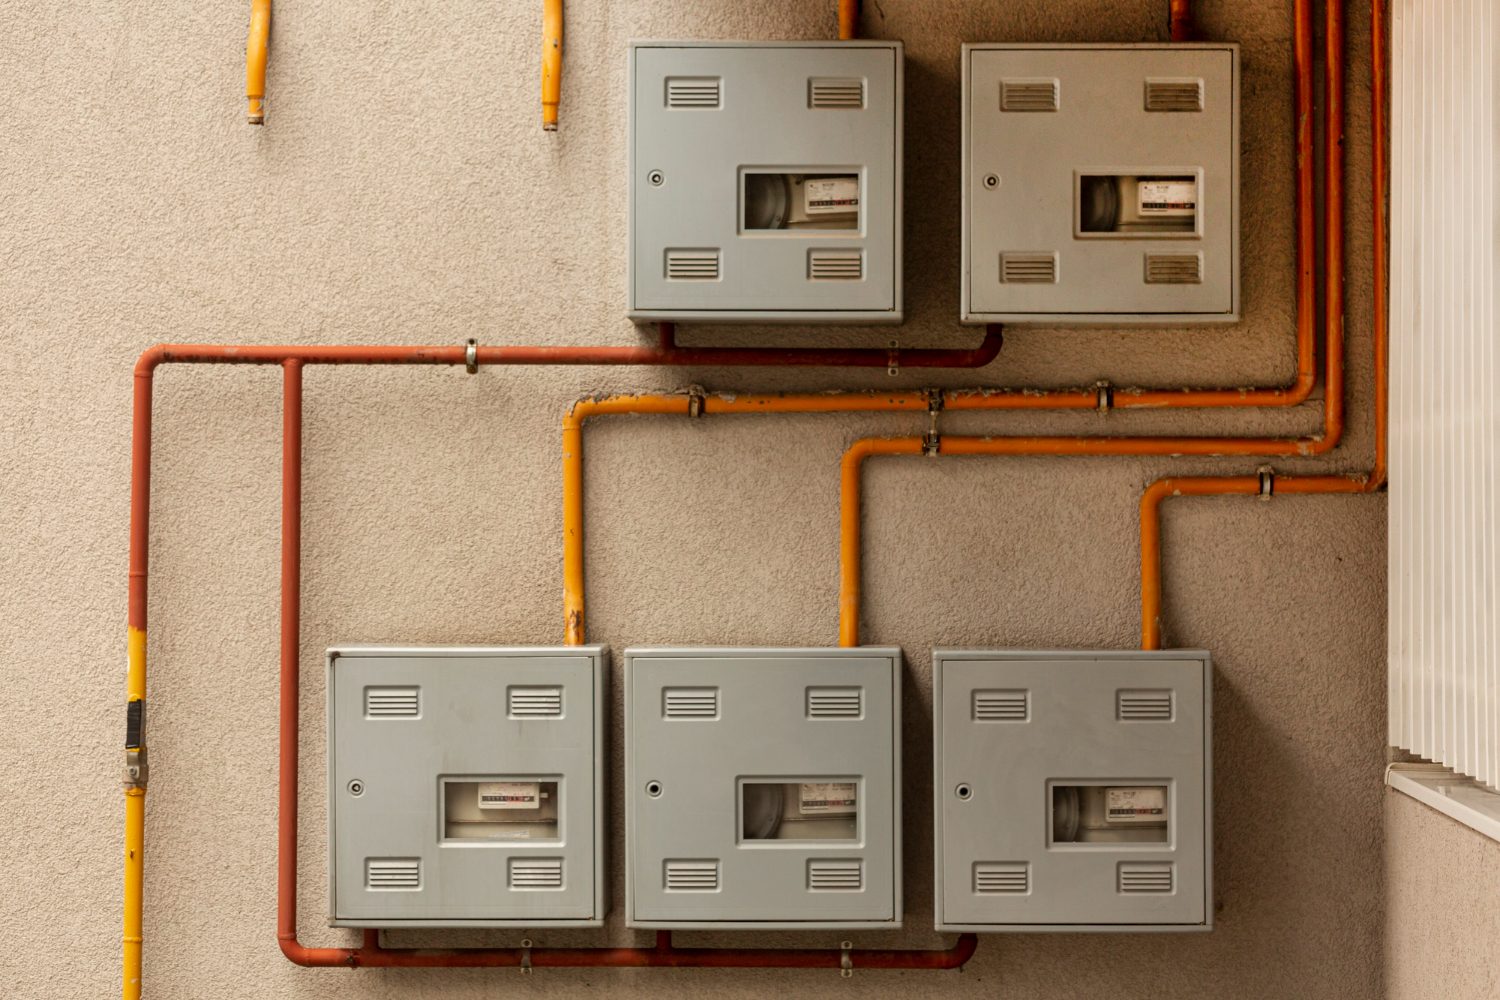
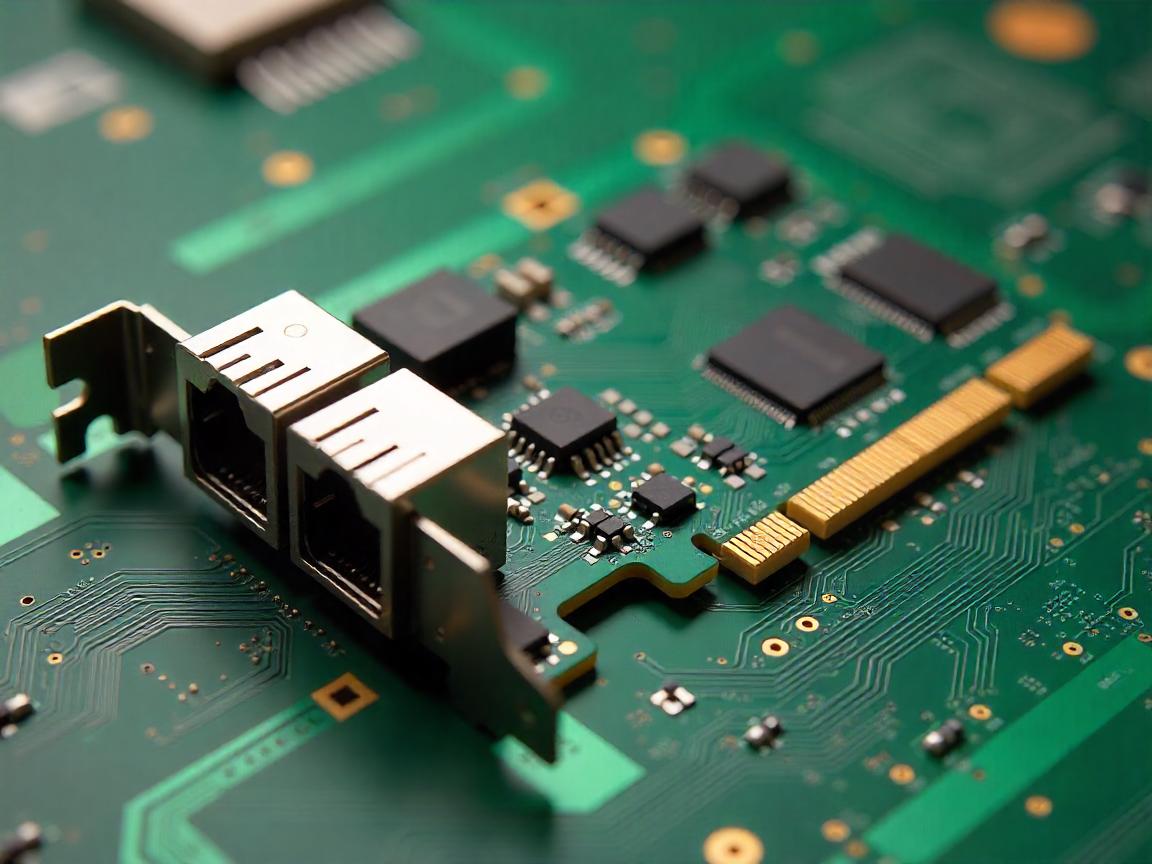
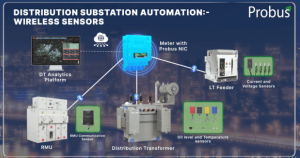
Meters, NICs, AMR devices, and gateways are only as reliable as the power that feeds them. In Indian distribution networks, that power is rarely clean, stable, or predictable. Voltage fluctuations, harmonics, momentary brownouts, and surges are part of daily operation. Hardware that is not designed to survive these conditions may function initially, only to degrade quietly over time.
Power supply design is therefore not an accessory choice. It determines whether smart grid hardware survives years in the field or fails prematurely.
The Reality of Power Quality in Distribution Networks
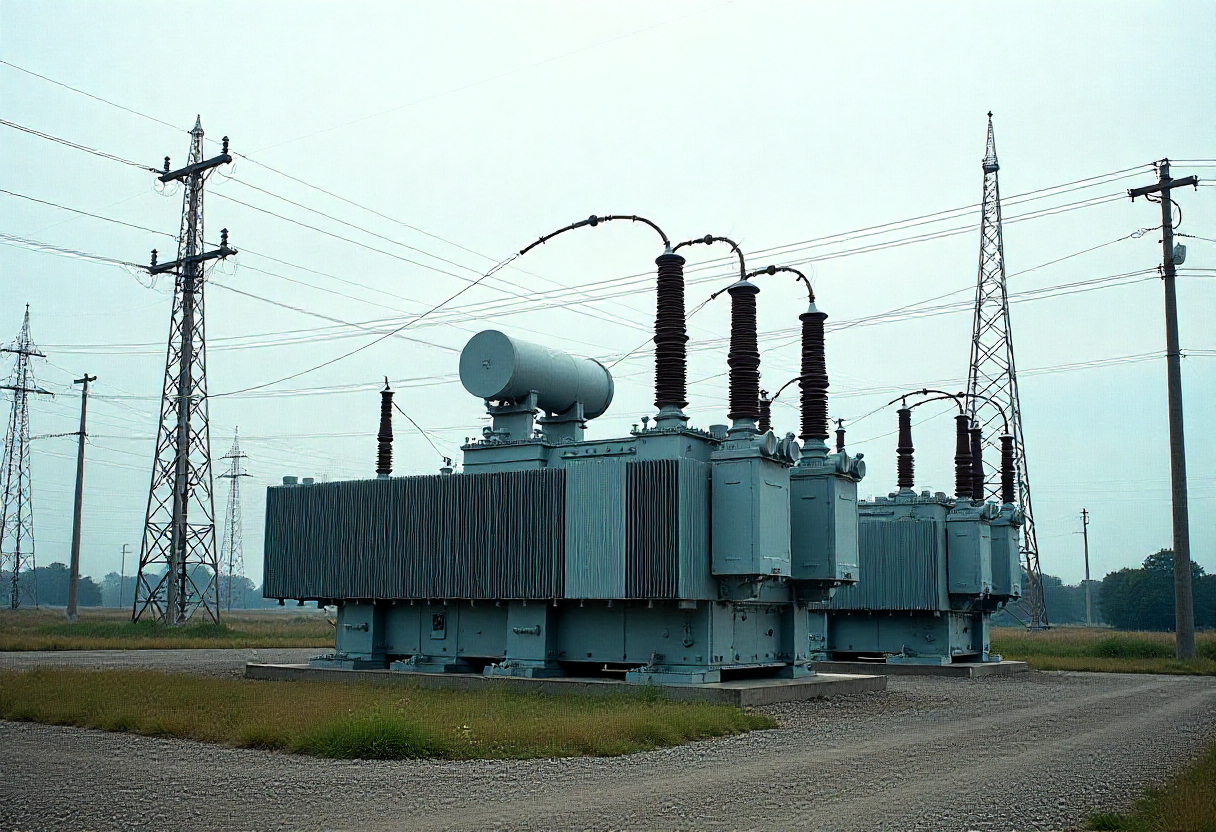
Distribution grids are dynamic systems. Loads change throughout the day, switching events are frequent, and renewable sources introduce variability. These conditions manifest as:
- Voltage swings beyond nominal limits
- Harmonic distortion from non-linear loads
- Momentary brownouts during peak demand
- Transient spikes during switching or fault events
While meters and communication devices experience these conditions continuously, many power supplies are designed assuming far cleaner input profiles. The mismatch between assumption and reality is where failures begin.
How Poor Power Supply Design Shortens Device Life
Power supplies that lack proper isolation, surge handling, or thermal resilience often fail gradually rather than catastrophically. Components run hotter. Capacitors age faster. Noise couples into sensitive circuits.
The symptoms are subtle:
- Intermittent device resets
- Communication dropouts without clear cause
- Gradual increase in failure rates after the first year
- Devices that pass lab tests but fail unpredictably in the field
These issues are difficult to trace back to the power supply, which is why they are often misattributed to electronics or software.
Why Isolation and Surge Tolerance Matter
Isolation protects devices from ground potential differences and transient events that occur regularly in distribution networks. Without adequate isolation, voltage spikes and noise propagate directly into logic and communication circuits.
Surge tolerance ensures that switching events and fault-related spikes do not permanently damage components. In grids where switching is frequent, this protection is essential.
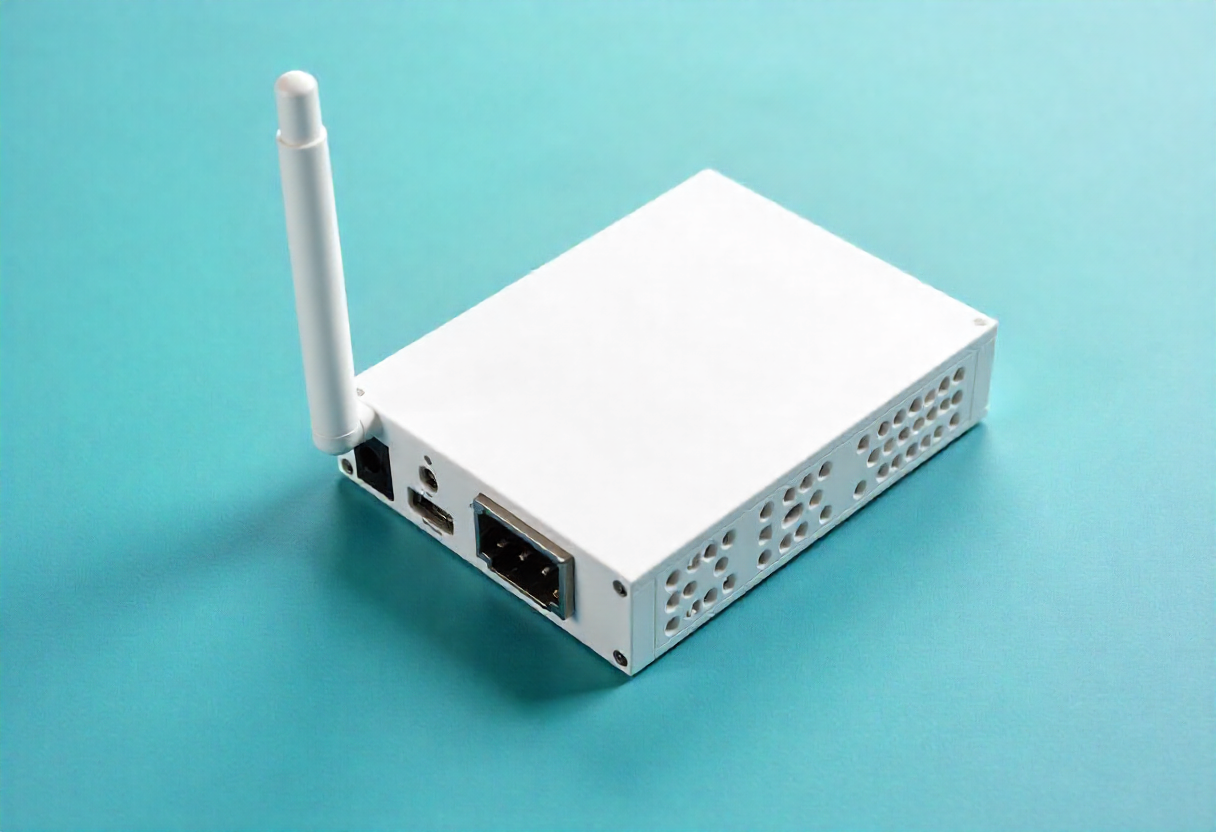
Probus power supplies are designed with these realities in mind. Both the Power Supply 3PH and the 4G AMR Power Supply incorporate isolation and protection strategies aligned with grid behavior, not idealized inputs.
Thermal Design as A Reliability Multiplier
Heat accelerates failure. Power supplies operating in compact enclosures, often without active cooling, must dissipate heat efficiently to avoid long-term degradation.
Thermal design influences:
- Component lifespan
- Voltage regulation stability
- Noise performance
- Overall device reliability
Inadequate thermal margins may not cause immediate failure, but they shorten operational life dramatically. Designing for sustained thermal stress is a necessity in Indian grid environments.
Designing for Grid Reality Not Lab Conditions
Laboratory testing validates functionality. Field reality tests resilience.
Probus designs power supplies with the assumption that voltage will fluctuate, harmonics will be present, and ambient temperatures will rise. Designs are validated not just for compliance, but for endurance.
This approach ensures that downstream devices remain stable even when upstream power conditions are imperfect. Reliability is built in at the foundation, not added later through software workarounds.
The Hidden Cost of Ignoring Power Supply Design
When power supply design is overlooked, the cost is rarely immediate. It appears over time as higher failure rates, increased field visits, and unexplained downtime.
By contrast, investing in robust power supply design reduces total cost of ownership. Devices last longer. Data remains stable. Maintenance becomes predictable.
For utilities, this translates into trust in infrastructure and confidence in long-term deployments.
Power as The First Engineering Decision
Smart grid hardware is often judged by its features. In practice, its lifespan is determined by how it handles power.
By treating power supply design as a first-order engineering decision, Probus ensures that its devices survive the realities of distribution networks. Not just on day one, but year after year.
In the grid, clean power is rare. Reliable hardware is designed accordingly.